
What is inteliCharts?
inteliCharts Platform allows individual, professional and institutional investors to access stock market data in the form of financial charts. inteliCharts engine automatically downloads requested data and stores it in a local SQL database. Once stored in the database, the stock data can be retrieved instantaneously even if access to the internet is not available. This document describes all the features of inteliCharts with examples of how to use them.
Versions of inteliCharts
Most of inteliCharts features are available to everyone as most of the features are part of inteliCharts Free edition. Some of the more advanced features are only available in Professional edition of inteliCharts. It is important to note that all technical indicators and overlays are available free of charge to all users. Some advanced indicator parameter modifications may be reserved for Professional edition users. All users have access to historical daily data, custom layouts, advanced drawing tools, ability to save custom layouts with all lines created. Some features of advanced drawing tools are only available in Professional edition of inteliCharts.
Starting the inteliCharts Platform
Once downloaded and installed inteliCharts icon can be found on your desktop, and in the Start menu. Clicking on the icon starts the program by first checking for updates.
If a new version of inteliCharts is found you will be prompted to install the update. It is recommended to always install the newest version of inteliCharts since it contains program improvements and enhancements.
Entering Ticker Symbol
Ticker symbol is entered in the text box located in the top left corner of the main chart control window.
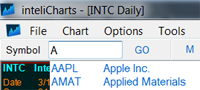
If you have multiple charts open the new ticker will be applied to the last active chart. The last active chart is the chart contained in the last active window. The last active chart can also be identified by bold ticker description in the top left part of the chart. Once you enter the ticker in the text box you can either press Enter or press the GO button located right next to the ticker text box.
Changing the Chart's Interval
Each bar on a chart represents a unit of time called interval. You can change the interval in three different ways.
• From the main chart control window select Chart, expand Interval from the dropdown menu and then select available unit of time.

• Select any one of available interval symbol buttons located right next to the"GO" button.
• Right-click anywhere on the chart and select Interval from the dropdown menu.
Creating an Additional Charts
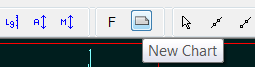
You can create as many charts as you wish. New charts can represent the same ticker or can be for a different stock or index. Creating a new chart window can be accomplished in two ways, either by selecting "New Chart" from the "File" dropdown menu or by clicking the "New Chart" button in the main control window.
Saving Layouts
You can save the current layout in the default location at any time by expanding the "File" menu and selecting "Save Layout" from the dropdown menu.
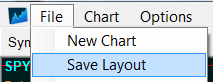
Save Layout option saves all of the open charts' ticker information, bar spacing, style, colors, all studies and all drawings. All of the windows locations, states and sizes are saved as well. Optionally you can right click anywhere on the chart and select "Save Layout" option from the dropdown menu.
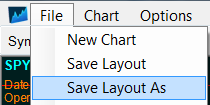
Saving the Current Layout As
"Save Layout As" allows you to save the current layout by specifying the layout file name. You can do that by expanding the "File" menu and selecting "Save Layout As" from the dropdown menu.
Save Layout As option saves all of the open charts ticker information, bar spacing, style, colors, all studies and all drawings. All of the windows locations and sizes are saved as well. Optionally you can right click anywhere on the chart and select "Save Layout As" option from the dropdown menu.
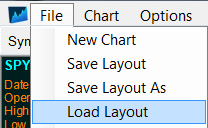
Loading Layouts
Any saved layout can be loaded by selecting "Load Layout" from the "File" menu.
Loading a previously saved layout automatically closes the current layout including all of the open chart windows. Before the open layout dialog appears you will be prompted if you wish to save the current layout. If you select "No" all current chart windows will close without saving any changes you may have made to the charts. "Load Layout" restores previously saved layout with all of the chart windows in the same saved location and state. Load Layout restores previously saved chart ticker information, bar spacing, style, colors, all studies and all drawings.
Closing the Current Layout
Selecting "Close Layout" from the "File" dropdown menu closes all the chart windows resulting in an empty workspace. Before the current layout closes you will be prompted if you wish to save the current layout. If you select "No" all current chart windows will close without saving any changes you may have made to the charts.
Saving Lines
Selecting "Save Lines" from the "File" dropdown menu opens up a save file dialog where you can select a file name from the list of files or create a new file. Lines that are going to be saved with this method are all the lines that belong to the active chart with all of their properties and ticker assignments. You can also save all the lines from the active chart by right-clicking anywhere on the chart and selecting "Save Lines" from the dropdown menu.
Loading Lines
Previously saved chart lines can be loaded into the active chart by selecting "Load Lines" from the "File" dropdown menu. Every line has its own stored properties and ticker assignment. These properties will be restored when the lines are loaded and all the lines will be assigned to their previously stored respective tickers. Stored lines can also be loaded by right clicking anywhere on the chart and selecting "Load Lines" from the dropdown menu.
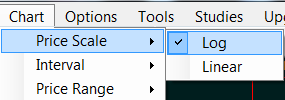
Changing Price Scale Type
Char's price scale can be set to either linear or logarithmic. To change the chart's price scale expand the "Chart" menu and select "Chart Scale" from the dropdown. There are two available selections: "Log" and "Linear", a check mark next to one indicates the type of scale currently selected.
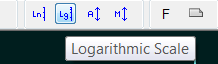
You can also use "Ln" and "Lg" buttons located in the main controls window to set the scale to linear and logarithmic respectively or right-click anywhere on the chart and select "Price Scale" from the dropdown menu.
Setting Price Range
To switch to manual price range expand "Chart" and select "Price Range" from the dropdown menu. Two options are available: "Auto" for automatic price scaling and "Custom" for setting the price range manually. Selecting "Custom" price scale option opens up a dialog where you can define the upper and the lower price limits for the active chart. Selecting "Auto" price scale restores automatic price scaling. Automatic and custom price range can also be set by clicking "A" or "M" buttons in the main control window
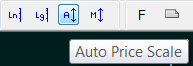
or right-click anywhere on the chart and select "Price Range" from the dropdown menu.
Changing Bar Spacing
Bar spacing determines how many price bars can fit into a particular chart window. Decreasing bar spacing increases number of bars displayed. To change bar spacing expand "Chart" and select "Bar Spacing" from the dropdown menu. You can also use "SP" buttons located in the main control window
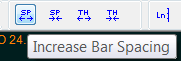
or right-click anywhere on the chart and select "Bar Spacing" from the dropdown menu.
Changing Bar Thickness
Bar thickness determines the weight of all the price bars. Decreasing bar thickness decreases the bars weight and vice versa. To change bar thickness expand "Chart" and select "Bar Thickness" from the dropdown menu. You can also use "TH" buttons located in the main control window
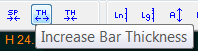
or right click anywhere on the chart and select "Bar Thickness" from the dropdown menu.
Changing Colors
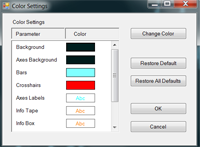
To change color properties of the active chart expand "Chart" in main control window and select "Colors..." from the dropdown menu. You can also select colors by right-clicking anywhere on the chart and selecting "Colors..." from the dropdown menu. Once Color Setting window opens you can change the color of the following chart properties: Background, Axes Background, Price Bars, Crosshairs, Axes Labels, Info Tape, Info Box, Main Info, Selected Bar and Axis Border.
Copying Chart Style
You can copy one chart's properties to another by expanding " Style" from the "Chart" dropdown menu and selecting "Copy Style" . By selecting "Copy Style" all of the currently active chart's colors and properties are copied and can be pasted to another chart making that chart look and feel exactly the same as the chart being copied. To apply copied style to another chart use "Paste Style" available in the same dropdown as "Copy Style". Both "Copy Style" and "Paste Style" are also available by right-clicking anywhere on the chart and selecting "Style" from the dropdown menu.
Pasting Chart Style
Previously copied chart styles can be applied to another chart by expanding " Style" from the "Chart" dropdown menu and selecting "Paste Style" . Both "Copy Style" and "Paste Style" are also available by right-clicking anywhere on the chart and selecting "Style" from the dropdown menu.
Pasting Predefined Chart Style
inteliCharts comes with predefined styles that can be applied to any chart by expanding " Style" from the "Chart" dropdown menu and selecting "Paste Default". This feature can also be accessed by right-clicking anywhere on the chart, expanding "Style" and selecting "Paste Default".
Displaying Snapshot Info Tape
Snapshot Info Tape contains the most recent bar's information: Last Date, Last Trade Time, Percentage Change, Change, Open, High and Low. To hide the Tape select "Options" and uncheck "Snapshot Tape" from the dropdown menu. The same can be accomplished by right-clicking anywhere on the chart and placing or removing a checkmark next to "Snapshot Tape".

To change the location of the information tape hover over it with the mouse pointer, click and drag the tape to your desired location.
Displaying Tracking Window
Tracking Window displays information related to the currently selected price bar. The displayed items are: date, open, high, low, close, volume, total number of all bars, currently selected bar index, crosshairs y-value and any indicator or overlay values. The x-axis time value is synchronized across all the charts if multiple chart windows are opened.
To hide the tracking window select "Options" and uncheck "Tracking Window" from the dropdown menu. The same can be accomplished by right-clicking anywhere on the chart and placing or removing a checkmark next to "Tracking Window". To change the location of the tracking window hover over it with the mouse pointer, click and drag the tracking window to your desired location.
Displaying Symbol Information
Underlying stock or index information can be accessed by expanding "Options" and selecting "Symbol Details" from the dropdown menu.
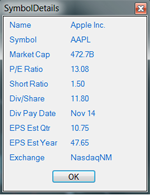
The stock information is displayed in a separate window and contains: company name, market cap, P/E ratio, short ratio, dividend per share, dividend pay date, EPS estimate quarter, EPS estimate year and the name of the exchange the security is listed on.
Price Data Reloading
If for some reason the stock price data is not properly reflected on the chart you can delete all the price data for the stock from the database and reload all the stock price data again. In order to reload the stock data expand "Options" located in main control window and select "Reload Data" from the dropdown menu.
Intraday Stock Price Updates
Stock and index prices are updated automatically for all of the stocks in currently open charts. To increase update frequency expand "Options" located in the main control window and select "Data Feed" from the dropdown menu. You can also press the button with the letter "F" in the middle to increase stock data update rate.
Using Line Tools
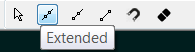
There is three different types of lines available with inteliCharts. Extended line type infinitely extends both ends of the line. Ray line type has one end and the other end is infinitely extended. Segment line type keeps both ends exactly as drawn. To select the line drawing tool expand "Tools" in the main control window or right click anywhere on the chart and select desired line tool from the drop down menu. You can also select any line tool by pressing one of the line buttons located in the main control window.
To draw a line start by placing the first point by left-clicking the mouse at the desired location. You do not have to hold the left mouse button down while you are dragging the other end of the line. If the line magnet feature is active and you are placing the line at the top or bottom of the price bar the line end you are placing will automatically "stick" to the price bar when the line is close to the bar. To deselect the line tool right-click anywhere on the chart, press "Arrow" button located next to line buttons or expand "Tools" in the main chart window and select "Pointer" from the dropdown menu.
Changing Line Type and Color
The line can be changed from one type to another by right-clicking the line and selecting "Type" from the dropdown menu. Possible line types are: extended, ray, reverse ray and segment. The line color can be changed by right-clicking the line and selecting "Color" from the dropdown menu.
Parallel Line Move and Copy
The line cloning feature creates a line that is parallel to the line being copied. In logarithmic scale environment the line being cloned retains its linear parallel properties to the line being copied. This feature allows for creation of unlimited number of lines that are parallel to each other in linear scale where the chart scale is logarithmic. To make a parallel clone of a line right-click the line and select "Clone" from the dropdown menu. To move a line double left-click on the line an drag it to desired location. The line copy and line move actions can be canceled by right-clicking while dragging the line.
Line Swivel
Line swivel is a feature where one end of the line is firmly in its place and the other end is being dragged to a new location. Existing line can be swiveled either by double left-clicking the end of the line and dragging it or by right-clicking the line and selecting "Left Swivel" or "Right Swivel" from the dropdown menu.
Line Magnet
Line Magnet feature allows for exact line ends placements when in the vicinity of a price bar.
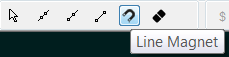
Placing the first line point on the top or bottom end of the stock price bar will automatically adjust the line end placement to the exact location of the price bar's top or bottom. Line Magnet feature aids in the exact placement of the second line end in the same way. Exact line end placement is confirmed by a visibly larger square around the line end being placed. To see if a line has exact placement points click the line to select it and locate the line ends which are marked with small squares around them. Line ends with perfect placements will have yellow squares around them.
Clear All Lines
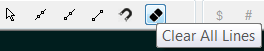
To remove all lines from the chart right-click the chart and select "Clear All Lines" from the dropdown menu. You can also select the eraser button located in the main control window.
Adding Price Overlays
Overlay study lines appear on top of price bars in the price plot area. To add an overlay to your chart, expand "Studies" in the main control window and select "Overlays" from the dropdown. The overlay dropdown contains a list of all the overlays inteliCharts support including:
- Bollinger Bands - Volatility indicator
- Double Exponential Moving Average - Smoothed exponential moving average
- Exponential Moving Average - Averaged price values over time
- Hull Moving Average - Smoothed moving average
- Kaufman Adaptive Moving Average - Moving average adjusted for volatility
- Linear Regression - Trend over specific time period
- Paraboloic SAR - Exit signals
- Simple Moving Average - Moving average
- T3 moving Average - Smoothed moving average
- Time Series Forcast - Trend over specific time period
- Triangular Moving Average - Triangular pattern weighted moving average
- Triple Exponential Moving Average - Combination of a single, double and a triple exponential moving averages
- Weighted Close - Smoothed moving average
- Weighted Moving Average - Smoothed moving average
- ZigZag - Trend signals
When an overlay study is selected a study settings dialog window will appear. Settings window allows you to change line colors, thickness and study parameters. To accept default setting select OK and the selected study will be plotted on top of the price bars.
Detailed descriptions of most overlays can be found in the Stock Technical Indicators section.
Adding Technical Indicators
Technical Indicators are collections of lines that are displayed below the main price panel. To add an overlay to your chart, expand "Studies" in the main control window and select "Overlays" from the dropdown. The overlay dropdown contains a list of all the overlays inteliCharts support including:
- Accumulation/Distribution Line - Price and volume based indicator
- Accumulation/Distribution Oscillator - Momentum for Accumulation/Distribution Line
- Absolute Price Oscillator - Derived EMA indicator
- Aroon - Beginning of a new trend indicator
- Average Directional Index - Direction and strength of the trend
- Average Directional Index Rating - Averaged ADX
- Average True Range - Volatility measure
- Balance of Power - Strength measure
- Chande Momentum Oscillator - Modified RSI
- Commodity Channel Index - Trend signal indicator
- Directional Movement Index - Momentum indicator
- Force Index - Strength of price change
- Fractal Dimension - Volatility or trend measure
- Hilbert Transform - Signal indicators
- MACD - Momentum oscillator for EMA difference
- Momentum - Measure of rate of price change
- Money Flow Index - Volume-weighted strength measure
- Normalized Average True Range - Volatility measure
- Normalized Volatility Indicator - Volatility measure
- On Balance Volume - Cumulative total of the up and down volume
- Percentage Price Oscillator - Momentum of percentage EMA difference
- Price Zone Oscillator - Price zones based indicator
- Rate of Change - Rate of price change
- Relative Strength Index - Trend direction strength
- RSI Inverse Fisher Transform - Entry and exit signals
- Spearman Indicator - Zone based entry and exit signals
- Stochastic Oscillator - Closing price to price range indicator
- TRIX - Smoothed moving average
- Ultimate Oscillator - Combined short, mid, and long term moving averages into one
- Volume Zone Oscillator - Zone based trand signals
- Williams %R - Zone based overbought, oversold signals
When a technical indicator is selected a study settings dialog window will appear. Settings window allows you to change line colors, thickness and study parameters. To accept default setting select OK and the selected study will be plotted below the main price bar pane.
Detailed descriptions of most technical indicators can be found in the Stock Technical Indicators section.
Editing Studies
To edit study parameters or study line properties expand "Studies" in the main control window and select "Edit" from the dropdown menu. From the dropdown of all active studies select the study that you want to edit. You can edit study's line properties for all technical indicators and overlays, additionally you can edit specific study parameters changing the way the study lines are calculated. You can also access study edit menu by right-clicking anywhere on the chart and selecting "Edit" from the dropdown menu.
Removing Studies
To remove a technical indicator of a price overlay from the chart expand "Studies" in the main control window and select "Remove" from the dropdown menu. From the dropdown of all active studies select the study that you want to remove. You can also remove a study by right-clicking anywhere on the chart and selecting "Remove" from the dropdown menu.
Detaching and Attaching Charts
Whenever you open a new chart the new chart window opens inside the main control window. You can detach any chart window from its control window by expanding "Window" and selecting "Detach" from the dropdown menu. You can also do that by right-clicking anywhere on the chart and selecting "Detach" from the dropdown. Detached windows can be attached back inside the main control window in a similar manner by selecting "Attach" from the dropdown menu.