Description
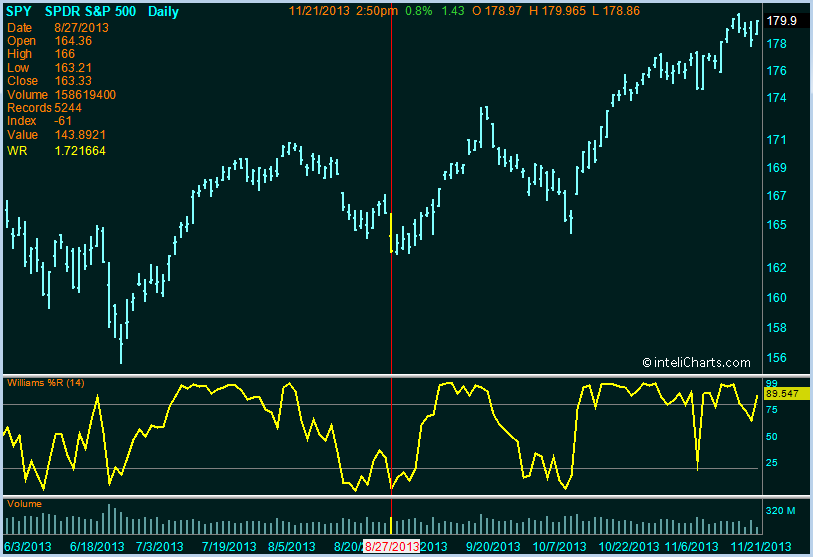
Williams %R is a momentum indicator similar to the Fast Stochastic Oscillator with phase and amplitude, but the plot is flipped over its x-axis. Williams %R indicator ranges between 0 and 100.
Formula
willArray[] =(highest(highArray[period])-close)/(highest(highArray[period])-lowest(lowArray[period]))*(-100)
Interpretation
Readings of Williams %R oscillator above 80 indicate overbought conditions, the indicator's range of -80 to -100 signals oversold conditons.

inteliCharts Predictive Analytics - Calculating Most Probable Future Stock Prices
- Neural network architecture
- Quantitative processing
- Long term forecasting
- Intraday probability channels
