Description
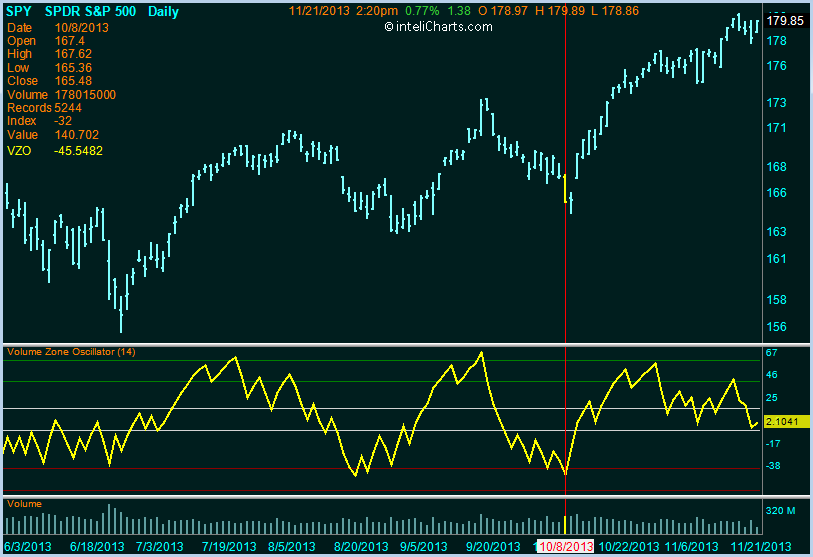
Volume Zone Oscillator is an indicator reflecting volume changes across several percentage levels: "-60", "-40", "-5", "+15", "+40" and "+60".
Formula
vzoArray[] = (EMA(close>close[-1] ? volume : volume*(-1))/EMA(volume))*100
Interpretation
Low levels of Volume Zone Oscillator may indicate oversold conditions, high levels may be a sign of overbought conditions.

inteliCharts Predictive Analytics - Calculating Most Probable Future Stock Prices
- Neural network architecture
- Quantitative processing
- Long term forecasting
- Intraday probability channels
