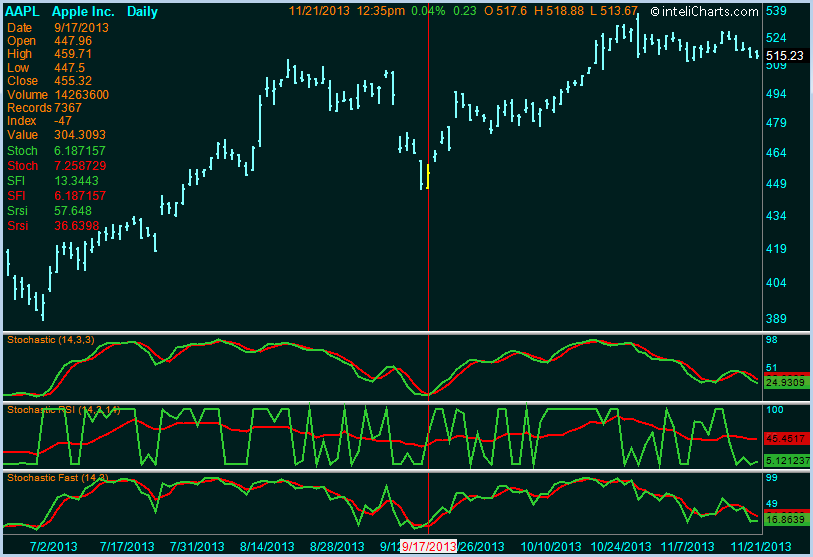
Description
Stochastic Indicators consist of two lines with the range between 0 and 100. It is calculated by finding a ratio of the closing price relative to the price range.
Interpretation
Stochastic line rising above -50 or crossing above the signal line triggers a buy signal, Stochastic falling below +50 or crossing below signal line triggers a sell signal. Stochastic line at extreme low may indicate an oversold condition. Values at extreme highs indicate overbought condition.

inteliCharts Predictive Analytics - Calculating Most Probable Future Stock Prices
- Neural network architecture
- Quantitative processing
- Long term forecasting
- Intraday probability channels
