Description
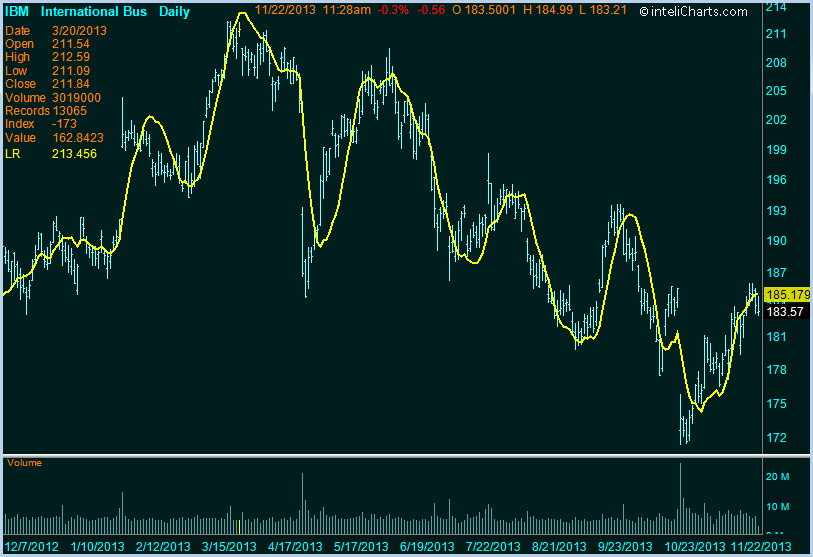
Linear Regression study plots a line indicating where the prices should be according to its statistical calculations. Linear Regression study reflects a trend line with less delay then moving average studies.
Interpretation
Linear Regression line is used to determine the direction of a trend.

inteliCharts Predictive Analytics - Calculating Most Probable Future Stock Prices
- Neural network architecture
- Quantitative processing
- Long term forecasting
- Intraday probability channels
