Description
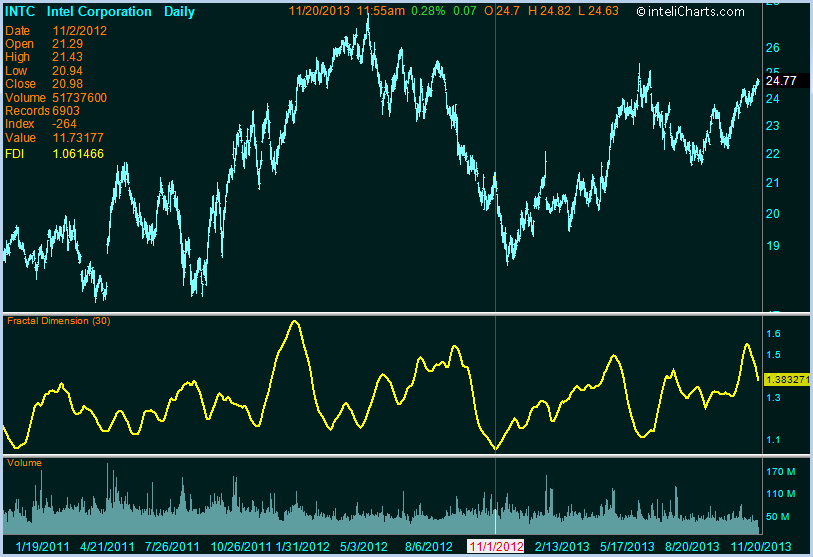
Fractal Dimension indicator determines the volatility or trendiness of the underlying security through re-scaled range analysis.
Formula
avrArray[] = (high+low)/2
smArray[] = (avrArray+avrArray[-1]*2+avrArray[-2]*2+avrArray[-3])/6
fdArray[] = periodAverage((log(period1max(smArray[])+period2max(smArray[]))-log(period3max(smArray[]))/log(2)+periodAverage(fdArray[-1])/2)
Interpretation
High values of FDI above 1.5 signal high volatility, values close to 1 indicate single direction trending of the underlying stock or index.

inteliCharts Predictive Analytics - Calculating Most Probable Future Stock Prices
- Neural network architecture
- Quantitative processing
- Long term forecasting
- Intraday probability channels
