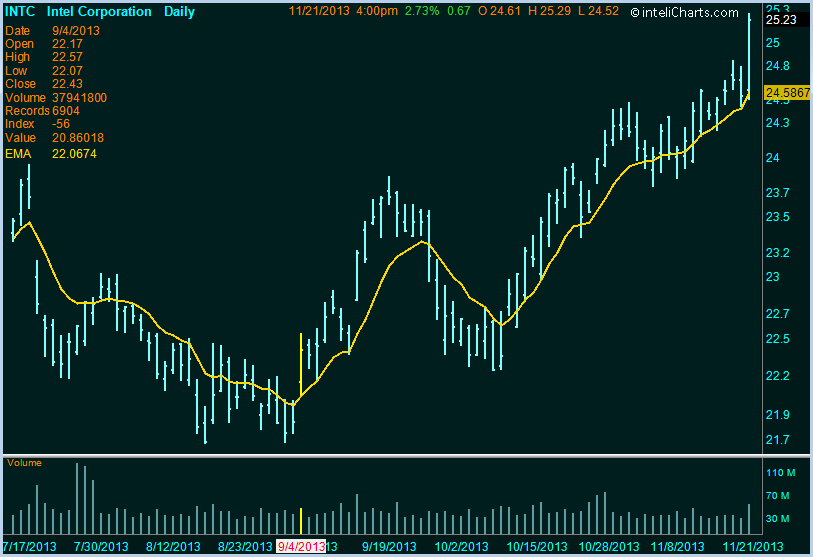
Description
Exponential Moving Average is calculated using all data in the time series. The most recent data values have a greater impact on EMA calculation while older values have diminished contribution to EMA calculations.
Formula
emaArray[] = (close-emaArray[-1])*2/(period-1)+emaArray[-1]
Interpretation
Exponential Moving Average line can be used as a support or resistance line. Prices moving below EMA in an uptrend may indicate trend weakening, prices moving above EMA in a downtrend signal weakening of that trend.

inteliCharts Predictive Analytics - Calculating Most Probable Future Stock Prices
- Neural network architecture
- Quantitative processing
- Long term forecasting
- Intraday probability channels
