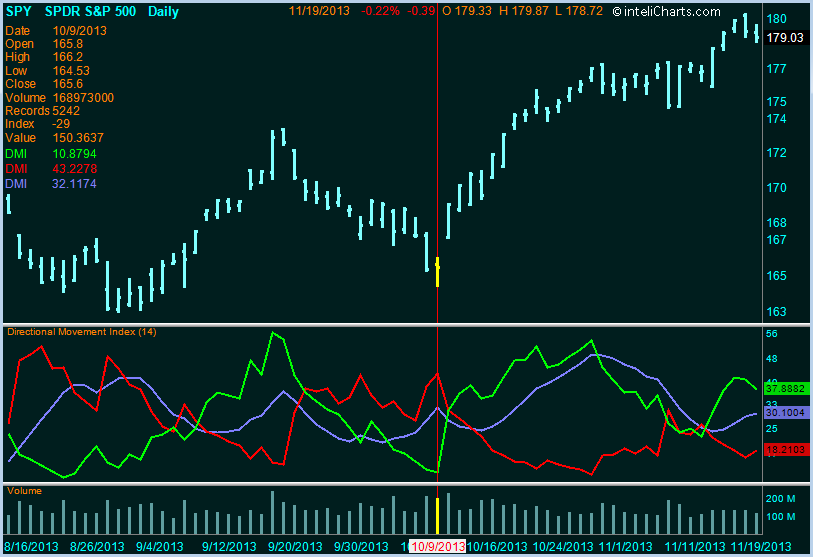
Description
Directional Movement Index consist of three oscillators: Directional Indicator+ (DI+), Directional Indicator- (DI-), and Average Directional Index (ADX). DMI is a trend identifying indicator.
Formula
refArray[] = periodEMA(max(max(high-close[-1],abs(high-close[-1])),abs(low-close[-1])))
lArray[] = periodEMA(high<=high[-1] & low<low[-1] ? low[-1]-low : (abs(high-high[-1])>abs(low-low[-1]) ? abs(high-high[-1] : 0))
hArray[] = periodEMA(high>high[-1] & low>=low[-1] ? high-high[-1] : (abs(high-high[-1])>abs(low-low[-1]) ? 0 : abs(high-high[-1]))
DIposArray[] = Array[]/refArray[]*100
DInegArray[] = lArray[]/refArray[]*100
adxArray[] = abs(DIposArray[]-DInegArray[])/(DIposArray[]+DInegArray[])*100
Interpretation
Directional Movement Index may be used as a trend identifier. DI+ crossing above DI- may be a sign of an uptrend, DI+ crossing below the DI- may signal a downtrend. ADX with rising values above 50 adds to the validity of DI+ and DI- signals.

inteliCharts Predictive Analytics - Calculating Most Probable Future Stock Prices
- Neural network architecture
- Quantitative processing
- Long term forecasting
- Intraday probability channels
