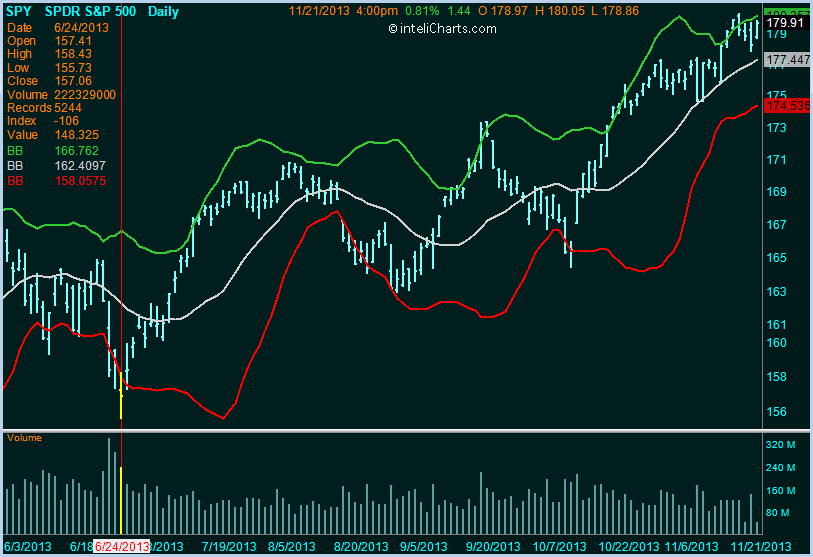
Description
Bollinger Bands consist of three lines - a Simple Moving Average line with two standard deviation lines on either side of SMA line.
Formula
midLineArray[] = SMA(close)
upperBandArray[] = SMA(close)+stdDev*SQRT(closeDev/period)
lowerBandArray[] = SMA(close)-stdDev*SQRT(closeDev/period) where
closeDev = SUM{n=0;n<period}(POW(close[n]-SMA(close)[n],2))
Interpretation
Prices moving close to the upper standard deviation line may indicate overbought condition, when prices reach close to the lower band oversold condition may be indicated.

inteliCharts Predictive Analytics - Calculating Most Probable Future Stock Prices
- Neural network architecture
- Quantitative processing
- Long term forecasting
- Intraday probability channels
