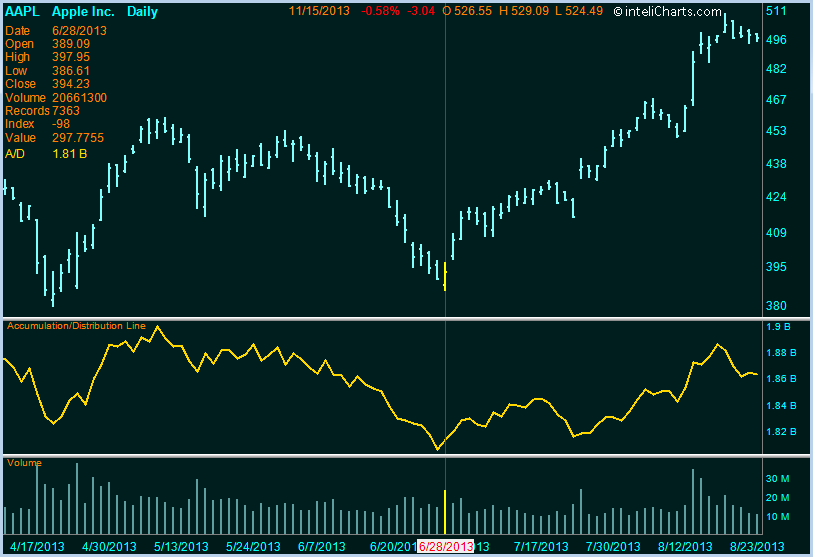
Description
Accumulation Distribution Line is a price and volume based cumulative indicator. It calculates movement within a single price bar, and uses the result to weight the volume of the current price bar. It cumulatively tracks the volume, and displays the result as a line with values above and below zero.
Formula
LineArray[] = (close - low - (high - close)) / (high - low) * volume
Interpretation
The Accumulation Distribution Line is interpreted by looking for a change of direction of the indicator relative to price. Upward trending Accumulation Distributions Line with downtrend in price may indicate reversal in price trend.

inteliCharts Predictive Analytics - Calculating Most Probable Future Stock Prices
- Neural network architecture
- Quantitative processing
- Long term forecasting
- Intraday probability channels
