Description
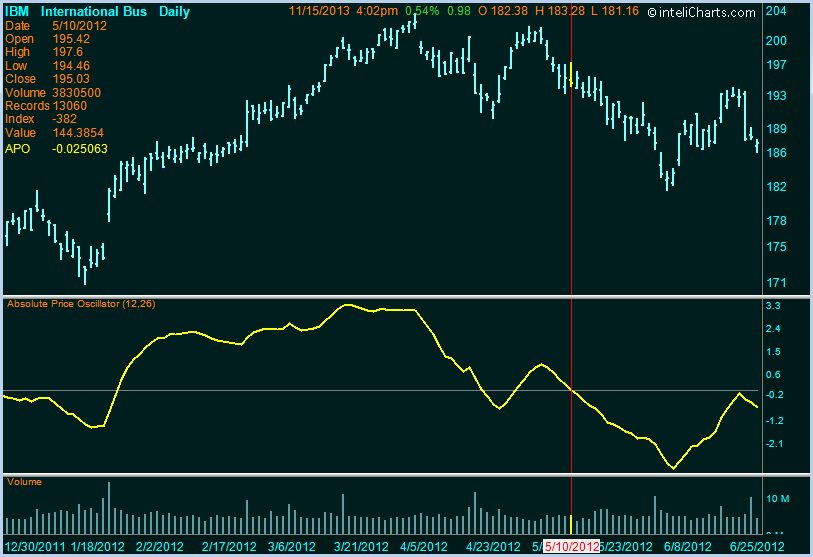
Absolute Price Oscillator shows the difference between short-term Exponential Moving Average (EMA) and long-term EMA.
Formula
LineArray[] = shortEMA - longEMA
Interpretation
A buy signal is generated when the Absolute Price Oscillator rises above zero and a sell signal is generated when it falls below the zero line.

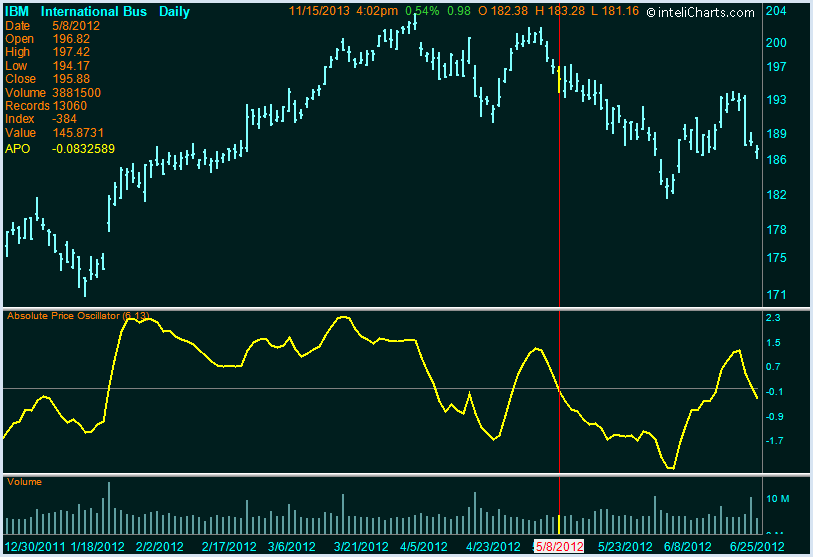
inteliCharts allows you to change input parameters for short-term EMA, log-term EMA and souce data for EMA calculation. The chart below reflects oscillator frequency change where both EMA periods are decreased and the ratio shortEMA/longEMA is maintained.

inteliCharts Predictive Analytics - Calculating Most Probable Future Stock Prices
- Neural network architecture
- Quantitative processing
- Long term forecasting
- Intraday probability channels
