
1.1 Stock Market Forecasting Overview
Stock Market Forecasting Service (SMFS) is an advanced, adaptable extension to inteliCharts charting platform. SMFS enables the user to automatically receive algorithmically-computed forecasts for a stock and then display the projections on a chart for further analysis. The objective of inteliCharts SMFS is to provide users with a clear visual display of data acquired from computer models. The user of SMFS must provide the careful analysis of weather a stock's forecast lines up across time intervals to determine the strength of the projection, and also consider other variables. SMFS simply provides the most probable future time series as projected by computer models.
1.2 Stock Market Forecasting – System Architecture
SMFS is of an n-tier architecture which contains three main software component layers.
The low-level layer computes predictive values. It is built on a neural-network framework and uses high-performance computers to run a permutable-symmetry model. The model is designed to be adaptive and is optimized to learn distinct chart patterns which are unique to individual stocks. Symmetry-analysis processing is very resource-intensive, thus the need for high-performance computer network to run the model. Although it is possible for the simulation to run on a single-processor unit, it is not practical since it would take several hours to obtain a result matrix for a single stock. SMFS low level layer can be further divided into four sub-tiers defined by monthly, weekly, daily and intraday intervals. Although each sub-tier is computed separately, long-range monthly projection matrix does have an effect on weekly data, weekly results in turn influence daily processing, and daily projections impact intraday forecasts. SMFS analysis are purely technical. Fundamental data, world events and other outside factors are never taken into account when Stock Market Forecasting Data is calculated.
The mid-level software component layer is designed to receive, store and distribute Stock Market Forecasting Data. Results of low-level processing are received by this layer and stored in inteliCharts database servers.
The top-level SMFS layer consist of inteliCharts charting software running on the user's computer. The user receives updated forecasts as soon as the predictive data becomes available on the mid-level database servers. Inter-layer update notification and data transfer is automatic and processing takes place in the background. Once the new data is received the updated projections are ready to be displayed for the user.

2.0 Activating Subscription License
In order to receive stock market forecast you need to complete the following steps:
1. Purchase one of inteliCharts subscriptions.
2. Once your purchase is finalized you will receive a product key. The key needs to be activated from within inteliCharts software in the following manner:
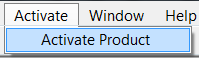
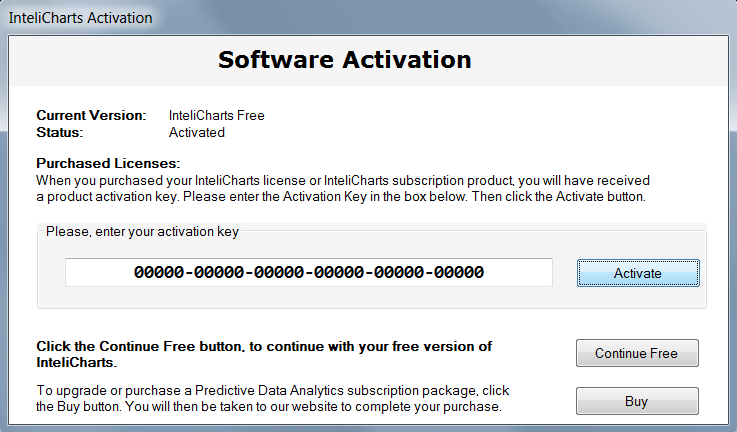
Click Activate from the Top Menu and then select Activate Product. Once inteliCharts Activation Page opens up, enter the subscription product key you received and click the Activate button
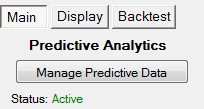
2.1 Predictive Stock Market Data Setup-Button Location
To access Stock Market Forecasting setup screen press Manage Predictive Data button located in the right control panel.
Pressing the button opens up Predictive Analytics Data Management dialog. Use this dialog window to add stocks to the list of stocks for which you wish to receive stock market forecasting data.
2.2 Adding Stocks to Stock Market Forecasting Subscription List
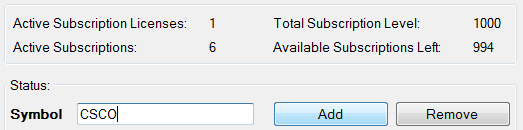
To add a stock to the list of stocks for which you request Stock Market Forecasting data, enter the stock's ticker symbol in a text box labeled Symbol and press the Add button. The list of stock tickers for which stock market forecasting is requested will be updated to reflect the newly added entry.
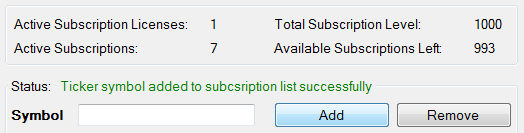
2.3 Removing Stocks from Stock Market Forecasting Subscription List
To remove a stock ticker from the list of stocks for which you receive Stock Market Forecasting, select the row which contains the stock ticker you want to remove and press the Remove button.
2.4 Stock Market Forecasting Subscription List
The list contains all stocks for which forecasting data was requested displayed in a table format with the following columns:
- Symbol – Stock's ticker symbol
- Predictive Data Status – Status can be one of the following:
- Setup – Each time you add a stock to the list, a forecasting data request is sent to inteliCharts server. Until the actual quantitative processing begins Setup Predictive Data Status is indicated. At this phase changes to the selection are still possible. To change your stock selection, select the row containing the stock ticker you want to change and click the Remove button.
- Processing – inteliCharts high-performance computers have begun the quantitative processing of the request. Selection changes are no longer possible until the next subscription billing cycle.
- Active – Requested Stock Market Forecasts are available for immediate display and further analysis. Forecasting data updates are received automatically.
- License – Specific subscription license information.
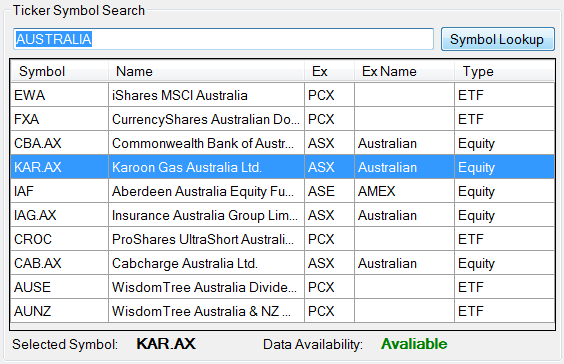
2.5 Ticker Symbol Search
Enter partial company or financial instrument information in the Ticker Symbol Search input box and press Symbol Lookup button located next to the search text input box. All relevant ticker symbols will be displayed together with full company name, exchange information and financial instrument type. The bottom of the search results displays additional information about Data Availability. Available status indicates Stock Market Forecasting Service is available for the selected ticker symbol.
2.6 License and Subscription Information
At the top of the window you can find the following Stock Market Forecasting license and subscription information:
- Active Subscription Licenses – The number of Active Subscription Licenses.
- Active Subscriptions – Total number of stocks and other financial instruments for which Stock Market Forecasting Services were requested.
- Total Subscription Level – The maximum number of stocks for which stock market forecasting data can be requested without purchasing additional licenses.
- Available Subscriptions Left – The number of stocks that can still be added to the Stock Market Forecasting request list.
- Activate Button – Pressing the button opens up a license activation window. Use it to activate purchased inteliCharts licenses.
- Buy Button – Use the Buy button to navigate to inteliCharts website where you can purchase Stock Market Forecasting Services subscription licenses.

3.1 Displaying Stock Market Forecasting Data
Availability of inteliCharts Stock Market Forecasting is indicated right under the Manage Predictive Data button.
Trial status allows the user to display stock market projections for a sample stock (GOOGL) for a period of 14 days.
Inactive indicates that the trial period has expired. To subscribe to inteliCharts Stock Market Forecasting please visit our products page.
Active status allows the user to enjoy full benefits of inteliCharts Stock Market Forecasting. Active status indicates that at least one subscription license has been activated and the system is auto-updating with the latest Stock Market Forecasting Data.
3.2 Ticker Symbol Selection
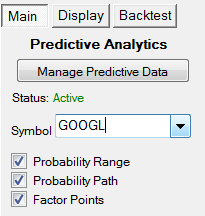
The selection box is located under Manage Predictive Data button. Users with Trial status may only select a single stock (GOOGL), Inactive status does not allow for any Stock Market Forecasting data display. Expending Ticker Symbol Selection dropdown reveals all active ticker symbols for which predictive data is available. Select a ticker symbol from the dropdown and the currently active chart will load the historical stock data and display time series projections for either weekly, daily or intraday interval.
3.3.1 Forecasting Study Selection
inteliCharts Stock Market Forecasting studies consist of Future Factor Points, Probability Range and Probability Path. All studies are calculated on inteliCharts high-performance computers.
3.3.2 Probability Range Indicator
Probability Range forecasting indicator is formed by linking future probability points as calculated by permutable-symmetry computer models. The forecast should be interpreted as a direct projection of the most probable future time series range, however further analysis are necessary in order to determine the strength of the signal. The computer model calculates upper and lower bounds of the indicator by linking future probability points based on their reference factor values. In general, the upper bound is weighted 1.05% to the upside and the lower bound's downside pressure is increased by 0.05% respectively when the future probability links are calculated.
3.3.3 Probability Path Indicator
Unlike Probability Range, Probability Path indicator is not weighted to either the upside or the downside when upper and lower bounds are calculated. The Probability Path indicator is a direct computer-model projection of the most probable future time series. If both Probability Range and Probability Path indicators are displayed at the same time, Probability Path is usually contained within Probability Range since the Range indicator upper and lower bounds are weighted to the upside and the downside respectively.
3.3.4 Factor Points
Factor Points are future points on a chart. Each point is defined by its base and extended properties. Base properties contain information about the location of a point on a chart as well as its base factor value. Base factor is calculated by adding factor values derived from symmetry lines that cross at the point. Extended properties define the point's relationship to other points in the array. Pattern recognition algorithms play a major role in defining these relationships by applying previously learned patterns to the point array in order to find most probable way each point might connect with other points in the future.
Each time new trades take place during market hours, inteliCharts software recalculates most probable connections between future points from the last trade's perspective and dynamically projects the point connections in a form of Probability Range and Probability Path indicators.
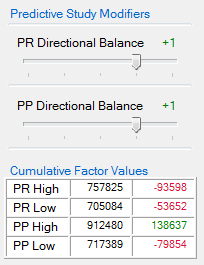
4.1 Predictive Study Modifiers
Stock Market Forecasting Data projected by inteliCharts represents a direct view of the most likely future times series as seen by inteliCharts computer models based on permutable symmetries algorithms. The projected data can undergo further analysis by applying Predictive Study Modifiers to Probability Range and Path indicators.
To explain how the Modifiers affect the projections, we are going to further describe the structure of point's extended properties and how each point connects to another in order to form a projection.
Each future point contains information linking it to five other points in the array, and those points have their own connections to other points. When probability indicators are calculated with Directional Balance set to zero, a path of connected points that returns the highest chain factor value is projected. Changing Directional Balance affects the way point connections are made. The best way to describe how the changes take place is by an example. Let's assume we change the Directional Balance from zero to one. Now each point's connection will be determined by not one but by two points selected from its extended properties list of points that have the highest chain factor values. Since our Modifier is set to a positive value, the connection will be made with a point that has a higher base value (but not necessarily a higher chain factor value). Decreasing Directional Balance below zero works in a similar way, only lower base-value points are chosen over points with higher base-values.
The above example is greatly simplified for clarity, the actual algorithm that determines future data point connections relies on other parameters as well to determine link priority.
4.2 Predictive Range Directional Balance (PR Directional Balance)
An increase in Predictive Range Directional Balance value affects the way future data points connect with each other and in most cases alter the projections. Positive Directional Balance settings increase selection priority of higher base values over lower base values generally resulting in a more bullish adjustment to the forecast. Decreasing Directional Balance below zero increases selection priority of lower base values over higher base values respectively, generally resulting in a bearish adjustment to the forecast. Very high-probability stock market forecasts tend to change insignificantly to Directional Balance adjustments since such projections contain future points with their extended properties pointing in the same general direction.
4.3 Predictive Path Directional Balance (PP Directional Balance)
Predictive Path Directional Balance adjustment affect the way the Probability Path indicator is calculated. Generally values below zero generate a bearish adjustment to the forecast, values above zero result in a bullish adjustment. As it is the case with PR Directional Balance described above, stronger projections are indicated when Predictive Path Directional Balance adjustments have little effect on the overall direction of the forecast.
5.1 Predictive Range and Predictive Path Cumulative Factor Values
The Cumulative Factor Values table contains cumulative base factor value totals for lower and upper Probability Range and Probability Path indicators. The far right column contains the difference between cumulative base factor value totals of Probability indicators with Predictive Study Modifiers set to zero (reference indicators), and base factor value totals of Probability indicators with Predictive Study Modifiers set to values other than zero (modified indicators). The difference between modified indicator factor values and reference indicator factor values displayed in the right column may be positive since future chain factors take priority over base factors.
Probability Range and Probability Path factors are displayed in a table format with the following rows:
- PR High – Probability Range High bound indicator.
- PR Low – Probability Range High bound indicator.
- PP High – Probability Path Low bound indicator.
- PP Low – Probability Path Low bound indicator.
6.1 Future Point Factor Values
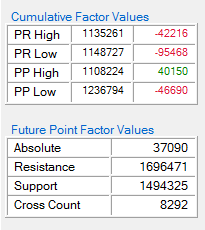
In order to populate the table with values, check "Factor Points" check box and select a point on the chart by clicking it to see the point's base properties:
- Absolute – Future point's Absolute Factor is calculated by inteliCharts computer-model and is based on priority levels of symmetry lines that cross at the point. Symmetry lines with higher priority levels increase Absolute Factor values cumulatively. Projection of brighter colors on the chart indicate future points with higher Absolute Factor values. Colors can be changed by selecting Display tab located right next to the Main tab.
- Resistance – Future point's Resistance value is calculated by inteliCharts computer-model and indicates a relative level of resistance at the given point and time. The value is derived from applying pattern recognition algorithms to the array of future points and computing how well the point fits within the patterns.
- Support – Future point's Support value is calculated using inteliCharts high-performance computers and indicates the point's relative level of support. This level is derived from applying pattern recognition algorithms to the array of future points and computing how well the point fits within the patterns.
- Cross Count – Future point's Cross Count value is a cumulative count of all symmetry lines that cross at the given point. High Cross Count values may indicate increased resistance or support levels.